Rep
Claude app or team chat
- Today's call list, each with the reason to call
- Drafted emails waiting for approval
- Post-call recap and follow-up, ready to send
"Who should I call first today, and why?"
For IT and telecom service providers whose sales teams have tools but no system. We install and run a seven-stage, AI-run go-to-market system in 30 days, in tools you own. Then we keep it running.
Pipeline Preview: 25 accounts in your market showing buying signals right now. Free, in a week.
Most IT and telecom sales teams already pay for a CRM, an email tool and a data source. What's missing is the system between them, and someone to run it.
of MSPs say acquiring new customers is their biggest challenge.
Source: Kaseya 2026 State of the MSP, 1,061 MSPssay the lack of a dedicated sales rep holds them back from winning customers.
Source: Kaseya 2026 State of the MSP, 1,061 MSPsProspect lists live in spreadsheets and reps' heads. Buying triggers get noticed by accident, if at all. The email tool doesn't talk to the CRM, so replies never get logged. Call notes stay in a notetaker. Close dates go stale between forecast calls. Every rep ends up building a personal system after hours.
Our own observation, from sales teams we've seen up close: there are often around seven tools between a buying signal and a booked meeting, and nobody owns the path through them. The fix isn't another tool. It's the connections, the playbook and someone running it.
AI agents run each stage on a schedule. A person approves anything that reaches a customer. Every stage writes back to the same CRM, so nothing lives in a side tool.
The systemBuilds and refreshes your target account list against the ideal customer profile you agree, tiered A, B and C.
A personThe ICP criteria, once. They change only when the evidence says so.
The systemSweeps your market every morning for 5–8 buying triggers agreed with you: standard ones like hiring, funding, new leaders, acquisitions and new offices, plus custom ones for your market, such as newly served addresses for a fiber provider.
A personWhich triggers count, and how each one is scored.
The systemFinds one to three buyers at every signalled account, then runs each email address through verification. Only verified addresses move on.
A personNothing here. It's a gate: the target is a hard bounce rate under 2%.
The systemDrafts first lines and sequences tied to the specific signal, and preps a call list with the reason to call. Sorts every reply (interested, objection, not now, unsubscribe) and drafts the response.
A personEvery enrolment and every first send. Calls are dialed by hand by your team, from a business line on their phone or desktop, and every call and text logs to your CRM automatically.
The systemBefore each meeting, a one-page brief. After it, a recap, a follow-up email draft, proposed CRM updates and a deal check: why change, why now, why us, is the decision maker engaged, and what's the next step. Filled from the call, not typed by your rep.
A personYour rep sends the follow-up. Meetings are recorded only with consent, announced at the start.
The systemA nightly sweep for stale stages, past close dates, missing next steps, deals with only one contact, and deal check questions nobody has answered yet. Your manager sees which question the team misses most. Every rep starts the day with a list of follow-ups due, also sent to their phone.
A personYour rep confirms each proposed change before it's written. Target: over 90% of open deals with a dated next step.
The systemBuilds the close plan, then logs agreement end dates as renewal tasks 90 days out.
A personYou run the close. The system makes sure the renewal never sneaks up on you.
Closed deals and renewal dates become new signals, so the loop starts again at stage 02.
HubSpot, the single record. Every stage reads from it and writes back to it.
Your playbook, brand voice, objection library and what's worked, read before every draft and updated every Friday.
Nudges, approvals and the Friday brief arrive by email and on your phone, with team chat available on request.
Every stage runs on Closerloop's own pipeline before it reaches a client.
Nobody opens seven tools. Each person works from one console, and it reads and writes across all of them.
Claude app or team chat
"Who should I call first today, and why?"
Claude app and pipeline view
"Which deals need me before Friday?"
Weekly brief
"Will we hit the quarter, and what's at risk?"
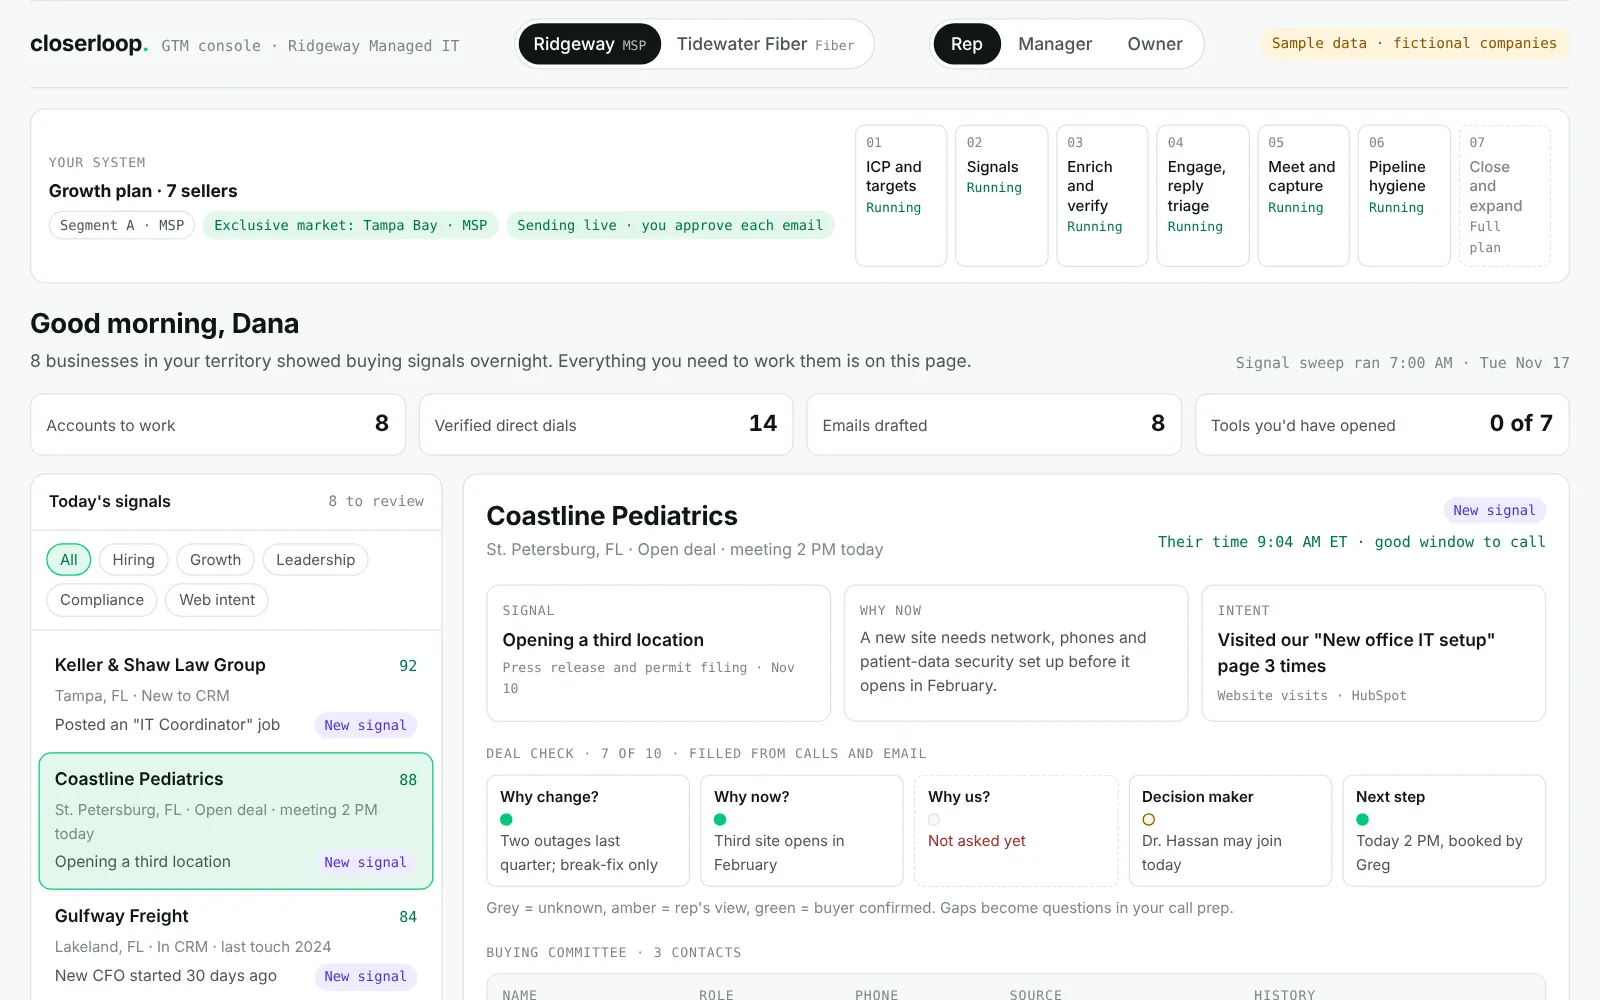
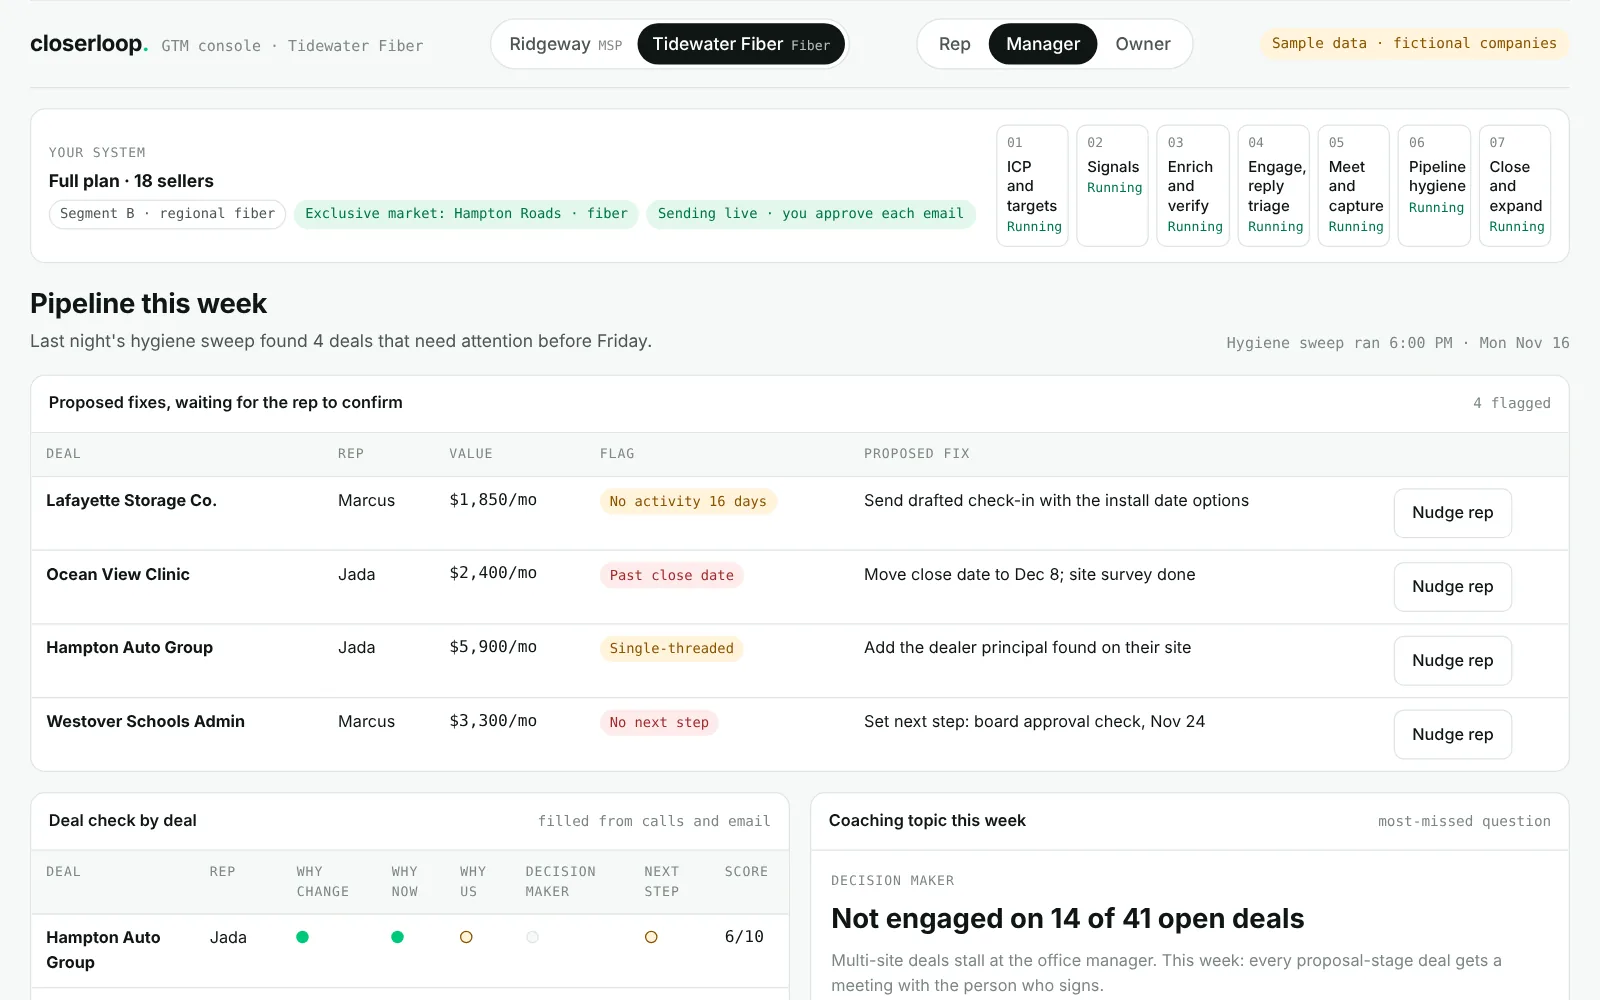
Try the interactive demoSample data, fictional companies. Switch between an MSP and a fiber provider.
Every option ends on the same monthly management fee. What changes is who holds the licenses, and how much migration comes first. We start every client today on option B; A and C open next.
"We're not tied to anything. Deploy it and run it."
We set up, license and run everything, including migration. Licenses are billed as one line, in your name wherever the vendor allows.
"We'll buy the licenses. You implement and run it."
You buy the tools directly from each vendor. We implement, migrate, configure and run them. Your vendors bill you directly.
"Keep what works, add what's missing."
We keep the tools that work, add what's missing, connect it all and migrate only what's being replaced.
Signal-led outreach running within 30 days of you granting full tool access. The promise covers what we control, which is delivery, not your close rate.
Wherever a vendor allows it, even when we manage everything. If you leave, your accounts and data leave with you.
Light migrations are included in the build. Anything bigger is scoped and quoted before you sign.
Your lists, signals, messaging and results are never used for another client. Your triggers and messages are set with you, and your team can edit every one.
US companies selling recurring IT or telecom services to businesses.
Core: 5–40 sellers
You hear things like "our reps don't prospect consistently, and the CRM is a mess," or "we've lit new areas and need to fill them fast."
Launch: 1–4 sellers
Fixed scope, smaller price. If you're building lists, sequences and the CRM by hand at night, this is the system you'd build if you had the time.
Fixed scope, priced on the system and its upkeep, never on hours. Taking clients now: Launch and Core. Growth and Full open next.
| Package | Sellers | Stages | Monthly |
|---|---|---|---|
| Launch | 1–4, growing | 01–04 | from $1,000 |
| Core | 5 included | 01–04 | from $2,500 |
| Growth | 8 included | 01–06 | from $3,500 |
| Full | 16 included | 01–07 | from $5,000 |
Plus a one-time build. One in-house SDR costs $110,000–173,000 a year fully loaded (Glencoco 2026); a full Closerloop system is about $34,000–72,000 in year one.
Not sure which fits? Build your system in 2 minutes
Closerloop was started by a career B2B seller who built lists, sequences and CRM workflows by hand after hours. It's the system we wished we'd had.
More on what we believe and how we work
Put a system behind the sellers you already have. It watches your market for businesses showing buying signals, finds and verifies the person who decides, and drafts outreach your team approves and sends. One in-house SDR costs $110,000–173,000 a year fully loaded, with a 3–6 month ramp (Glencoco 2026). A full Closerloop system costs about $34,000–72,000 in year one. Read the full answer.
Launch starts at $1,000 a month for growing firms with 1–4 sellers, plus a one-time build of $2,000–3,000. Core starts at $2,500 a month with 5 sellers included and a build from $4,000. Growth ($3,500, 8 sellers) and Full ($5,000, 16 sellers) open next, once our first clients have run them. Today we run licenses you hold; each extra seller is $85 a month. The Pipeline Preview is free. See full pricing.
No. If you run HubSpot, we build on it and it stays your single system of record. Salesforce is scoped case by case. If your deals live in a PSA's sales module or in spreadsheets, we set up HubSpot as the sales record and use your PSA's own sync for the handoff to service. Any migration is priced up front.
You keep everything. Licenses sit in your name wherever a vendor allows it, even when we manage the whole stack, and your data, accounts and messaging are yours. You can export all of it. After the initial term, you can leave with 60 days' notice.
No. You approve every enrolment and every first send, and during the soft launch you approve every send. Calls are dialed by hand by your team, from a business line on their phone or desktop, and every call and text logs to your CRM automatically. The system drafts; a person on your side decides.
Live and producing signal-led outreach within 30 days of you granting full tool access, or the next month is free. We aim for first results around day 45. Inbox warmup is the longest step, so it starts on day 3, alongside everything else.
Grant tool access in the first three days, join a 90-minute workshop on your triggers and ideal customer, approve the playbook, and approve sends during the soft launch. Everything else is ours.
No. It's a managed system, run for you. AI does the repetitive work on a schedule (sweeping signals, verifying data, drafting, logging), and a person on your team approves anything that reaches a customer. We operate it, fix it when something breaks, and improve it every week.
Get 25 accounts in your market showing buying signals right now, with the decision-makers verified and an opening line for each. Free, in a week, walked through on a 20-minute call.